LogAnalytics 2.0
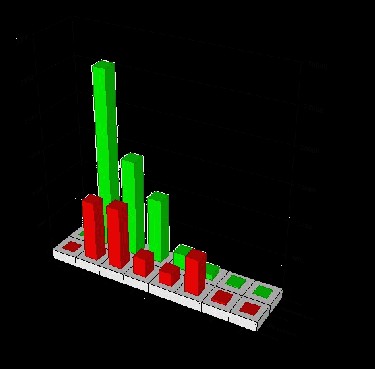
 LogAnalytics automatically accumulates the necessary data simultaneously from several polytypic log sources, realizes user-defined statistical treatment and presents results in a set of easy-to-understand rotatable 3D graphs through a convenient WEB-based interface.
|
LogAnalytics automatically accumulates the necessary data simultaneously from several polytypic log sources, realizes user-defined statistical treatment and presents results in a set of easy-to-understand rotatable 3D graphs through a convenient WEB-based interface.
Features:
Automated and simultaneous source data gathering and statistical treatment ;
Various incoming data source:
Any text file (for a software analyzing);
Serial communication port (for PBX etc);
TCP connection, including internet connection (for appliances);
UDP listener (Sys Log);
ODBC compatible source (for databases);
Source Log format parsers are completely configurable separately for each Log source ;
Multiple synchronized graphs on each Log source ;
Completely user defined statistics with filtering and grouping ;
Multiple simultaneously displayed results in each graph ;
Multiple statistical operations ;
Remote diagram management ;
3D rotatable graph results ;
Client-Server technology. Web interface, embedded configurable Web server ;
Password protection ;
XML import/export for Data Sources and Diagrams ;
Configuration tester/composer for Data Sources and Diagrams ;
Free 14-days trial versions are available ;
tags![]() data sources sources and and diagrams for data log source statistical treatment each log user defined
data sources sources and and diagrams for data log source statistical treatment each log user defined

Download LogAnalytics 2.0
Purchase: ![]() Buy LogAnalytics 2.0
Buy LogAnalytics 2.0
Similar software
 LogAnalytics 2.0
SphinxSoftware
LogAnalytics automatically accumulates the necessary data simultaneously from several polytypic log sources, realizes user-defined statistical treatment and presents results in a set of easy-to-understand rotatable 3D graphs through a convenient WEB-based interface.
 LogAnalytics Premium 2.0
SphinxSoftware
LogAnalytics automatically accumulates the necessary data simultaneously from several polytypic log sources, realizes user-defined statistical treatment and presents results in a set of easy-to-understand rotatable 3D graphs through a convenient WEB-based interface.
 LogAnalytics Gold 2.0
SphinxSoftware
LogAnalytics automatically accumulates the necessary data simultaneously from several polytypic log sources, realizes user-defined statistical treatment and presents results in a set of easy-to-understand rotatable 3D graphs through a convenient WEB-based interface.
 LogAnalytics Outpost Edition 2.0
SphinxSoftware
LogAnalytics automatically accumulates the necessary data simultaneously from several polytypic log sources, realizes user-defined statistical treatment and presents results in a set of easy-to-understand rotatable 3D graphs through a convenient WEB-based interface.
 Data Exchange Wizard 5.2.2.5
DB Software Laboratory
This Wizard helps you to load and export data from/into various data sources such as delimited and fixed width files or ODBC data source into/from Oracle, MS SQL Server or any ODBC compliant database
Data Exchange Wizard uses native API and performs calculation during import, executes SQL statements before and after Import or Export .
 Data Replication Engine 1.0
Zbit, Inc.
Using Zbit, Inc's Data Replication Engine users can easily replicate one source database to multiple destination databases simultaneously using multiple tables in the source database.
 DTM ODBC Manager 1.04.06
DTM soft
DTM ODBC Manager is a free simple and easy-to-use ODBC Data Sources manager.
 ByteWedge Professional 3.3 build 2356
Fog Software, Inc.
There are many scientific, engineering, medical devices and instruments that use the RS-232 (serial port) interface to send data to a computer for further logging and analyzing.
 Neodeck Data Spy 1.0
Neodeck Software
This is an application designed to allow the user to view, edit and monitor data from different data sources at the same time.
 Data Paint 4
Man Machine Interface
Data Paint is a free program that was designed to allow the user to paint the data in charts and graphs visually and numerically.