ImageDIG 2.0.7
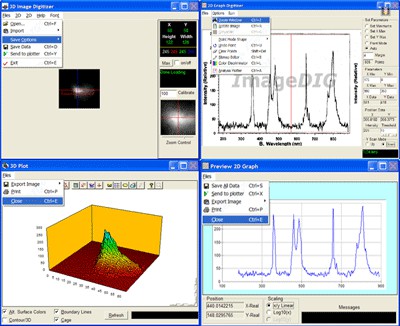
 ImageDIG consists of three integrated modules which allow the user to convert 2D flat images into 3D (x,y,z) data or if a graph, convert the graph in image form into 2 dimensional numerical data.
|
ImageDIG consists of three integrated modules which allow the user to convert 2D flat images into 3D (x,y,z) data or if a graph, convert the graph in image form into 2 dimensional numerical data.
The third module is a full analysis plotting utility where the user can import either the 2D or 3D data saved above or import any number of columns of data from a file. The data can then be analyzed using several statistical functions and plotted.
ImageDIG was developed because other functionally similar programs (2D) either had a steep learning curve, incomplete or confusing to use. However, no other program includes an image to 3D numerical data converter and a general purpose x/y plotter.
A variety of data analysis options are available in this module. Example images for tutorial purposes are supplied. This includes real world images of an electron beam for the 3D digitizer.
Computer generated plots (linear, log, fractional, etc), scanned images from articles for the 2D digitizer, and ascii data files for the universal plotter.
Graph processing functions include statistical analysis such as: Min/Max/Mean Fitting - Standard deviation, best fit, and curve fit. Curve fit includes: variable-order polynomial, logarithmic, exponential, power, inverse, spline, and moving averages
Additional features include a built in bitmap editor, magnifier and spreadsheet style data viewer/editor for the 2D scanner module.
Complete control of the graph windows such as Labels, Legends, Grids, Colors, etc through the Graph Toolbox.
Import image from the clipboard or from a TWAIN compatible device directly into the 2D or 3D scanner image box including Web images.
tags![]() for the the graph curve fit numerical data the user
for the the graph curve fit numerical data the user

Download ImageDIG 2.0.7
Purchase: ![]() Buy ImageDIG 2.0.7
Buy ImageDIG 2.0.7
Similar software
 ImageDIG 2.0.7
SciCepts Engineering
ImageDIG consists of three integrated modules which allow the user to convert 2D flat images into 3D (x,y,z) data or if a graph, convert the graph in image form into 2 dimensional numerical data.
 Nonlinear regression analysis - CurveFitter 1.1
Institute of Mathematics and Statistics
Nonlinear regression analysis - CurveFitter software performs statistical regression analysis to estimate the values of parameters for linear, multivariate, polynomial, exponential and nonlinear functions.
 LAB Fit Curve Fitting Software 7.2.38
Wilton Pereira da Silva
LAB Fit Curve Fitting is an application that can help with the process and analysis of experimental data.
 yoshinoGraph 1.0 beta2
Harukazu Yoshino
yoshinoGRAPH is a free, small and fast scientific graph software for data analysis and presentation.
 Graph Digitizer Scout 1.24
ByteScout
Graph Digitizer Scout will automatically convert hard-copy graphs, oscillograms, charts, plots, into X,Y.
 GetData Graph Digitizer 2.22
S. Fedorov
GetData Graph Digitizer is a software that lets you digitize graphs and plots.
 Rt-Plot 2.8.10.83
Rt-Science
Rt-Plot is a useful tool that will generate Cartesian X/Y-plots from scientific data.
 GraphSight 2.0.1
Cradle Fields, Inc.
GraphSight is designed for 2D math graphing needs.
 xyExtract Graph Digitizer 2.4
Wilton Pereira da Silva
The "xyExtract" software is used for to extract data from a 2D graph (orthogonal and nonorthogonal axes) contained in a graphic file (scanned, PDF document or in a some file like gif, jpg, etc).
 Bersoft Image Measurement 9.0
Bersoft Inc.
Bersoft Image Measurement (BIM) is created as a flexible tool for acquiring, measuring and analyzing digital images.