Magic Charts 2.7beta2
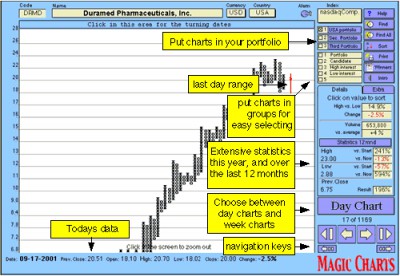
 Tool to easily follow the stock market using Point and Figure charts.
|
Tool to easily follow the stock market using Point and Figure charts.
tags![]()

Download Magic Charts 2.7beta2
![]() Download Magic Charts 2.7beta2
Download Magic Charts 2.7beta2
Purchase: ![]() Buy Magic Charts 2.7beta2
Buy Magic Charts 2.7beta2
Similar software
 Magic Charts 2.7beta2
Magic Potion
Tool to easily follow the stock market using Point and Figure charts.
 CharTTool 2.22
Ashkon Software L.L.C.
CharTTool is an advanced stock market internet browser application that will instantly allow you to display several technical charts for stocks, mutual funds or indices.
 Virtual Stock Trader 1.0.22
MC Software
Virtual Stock Trader is a useful software that allows you to hone your trading skills using past data.
 Stock Prediction Based on Price Patterns 1.0
Luigi Rosa
Stock Prediction Based on Price Patterns is a free and very useful financial advisor.
 XLChartPro 1.0
Penzina Pty Ltd
Produce Point and Figure Charts in Excel choosing from a variety of scales, number of reversals and box sizes.
 Stock Chart Wizard 1.6
Stock Chart Software
Stock Chart Wizard downloads freely available stock market data on individual stocks and displays technical charts and indicators.
 World Stock Charts 2.0.6
Qwill Ltd
World Stock Charts is a one stop solution for Charting and Tracking Stocks, Funds and Indices.
 Stock Market e-Class 1.0
Sunlight Design PRO
 Stock Watch 1.2
Dean Morrison
Stock Watch is a useful, free and comprehensive stock tracker and performance monitor.
 ITLocus Charting 1.4.15
ITLocus.com
IT Locus Charting is an advanced charting application for graphical analysis of financial and stock market.