ITLocus Charting 1.4.15
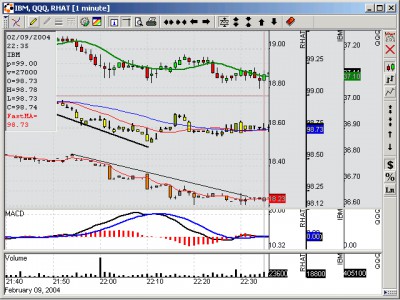
 IT Locus Charting is an advanced charting application for graphical analysis of financial and stock market.
|
IT Locus Charting is an advanced charting application for graphical analysis of financial and stock market.
It supports any number of windows with an arbitrary number of charts of stocks, futures, mutual funds or indices in each of them.
The list of technical indicators includes moving averages, relative strength index, MACD and others.
The charts may be saved and printed, and the historical stock quotes may be exported for independent analysis. IT Locus Charting works with end of day (EOD) data and with realtime and historical data from commercial providers.

Download ITLocus Charting 1.4.15
![]() Download ITLocus Charting 1.4.15
Download ITLocus Charting 1.4.15
Purchase: ![]() Buy ITLocus Charting 1.4.15
Buy ITLocus Charting 1.4.15
Similar software
 ITLocus Charting 1.4.15
ITLocus.com
IT Locus Charting is an advanced charting application for graphical analysis of financial and stock market.
 CharTTool 2.22
Ashkon Software L.L.C.
CharTTool is an advanced stock market internet browser application that will instantly allow you to display several technical charts for stocks, mutual funds or indices.
 World Stock Charts 2.0.6
Qwill Ltd
World Stock Charts is a one stop solution for Charting and Tracking Stocks, Funds and Indices.
 Stock Aides 1.5
Timing Laboratories LLC
Stock Aides is a stock charting, analysis, and information retrieval application for Windows.
 Equity Rider 2.1
Equity Rider Trading Inc
EquityRider is an advanced tool designed for stock charting and trading systems analysis software for many markets: stocks, forex, and futures.
 Stock Predictor 1.1.361
Ashkon Technology LLC
Stock Predictor is an advanced stock charting and investment strategy performance analysis software for financial market information.
 TraderXL Pro 6.1.33
OLSOFT
TraderXL Pro - powerful technical analysis and data downloading software for Microsoft Excel.
 Indicator Analysis 1.0
Indicator Analysis
Indicator Analysis is a FREE tool that allows stock analyzers to download mass, historical, stock data and perform technical analysis on it.
 Parity Plus 2.1
DataBull
Parity Plus is one of the most powerful Stock Charting and Technical Analysis software application available on the market.
 Widdly 2.0.5
widdly
Widdly is a very useful software designed for technical analysis charting and financial analysis of stocks, indicies, macroeconomical data, currencies, funds and more.