FindGraph 2.611
 Are you an engineer, scientist or graduate student looking for a graphing tool that will allow you to quickly analyze graphed data without having to immerse yourself into calculus and statistics books? You've just found the perfect solution.
|
Are you an engineer, scientist or graduate student looking for a graphing tool that will allow you to quickly analyze graphed data without having to immerse yourself into calculus and statistics books? You've just found the perfect solution.
FindGraph is a comprehensive, feature-rich graphing, digitizing and curve fitting software specially created for these purposes.
FindGraph is an engineer utility for graph plotting and data analysis.
FindGraph comes with a straightforward interface, 200 built-in common graphing functions (like Cardioid, Devil's Curve, or Double Folium), support for Polar, Cartesian, and Parametric equations, various data input/export features and printing options.
One of the major features FindGraph provides is an easy way to do curve fitting.
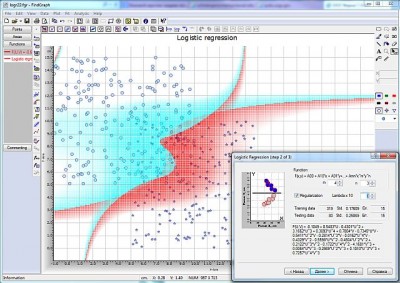
FindGraph offers 10 generic fits, including Linear Regression, Logistic Functions, Fourier approximation, Neural Networks plus a library of over 120 industry-specific formulas.
FindGraph features
By importing it from ASCII files created by other applications using an Excel-like data import feature;
By cutting and pasting it from other Windows based applications (Excel spreadsheets);
By digitizing screen charts;
By typing it into a standard spreadsheet interface.
With graphical editor you can easily:
Requirements
Limitations
tags![]() curve fitting disk space what you points and you can the program
curve fitting disk space what you points and you can the program

Download FindGraph 2.611
Purchase: ![]() Buy FindGraph 2.611
Buy FindGraph 2.611
Similar software
 FindGraph 2.611
UNIPHIZ Lab
Are you an engineer, scientist or graduate student looking for a graphing tool that will allow you to quickly analyze graphed data without having to immerse yourself into calculus and statistics books? You've just found the perfect solution.
 GraphSight 2.0.1
Cradle Fields, Inc.
GraphSight is designed for 2D math graphing needs.
 Advanced Grapher 2.2
Alentum Software, Inc.
Advanced Grapher - Powerful but easy-to-use graphing, curve fitting and calculating software.
 Function Grapher 3.9.2
GraphNow
Function Grapher is a easy-to-use software for 2D, 2.
 Rt-Plot 2.8.10.83
Rt-Science
Rt-Plot is a useful tool that will generate Cartesian X/Y-plots from scientific data.
 ZigZag 1.3
Palam Software, Inc.
ZigZag is a handy tool to plot and explore math functions.
 3D Grapher 1.21
RomanLab Software
3D Grapher is a feature-rich yet easy-to-use graph plotting and data visualization software suitable for students, engineers and everybody who needs to work with 2D and 3D graphs.
 Graph 4.4.2
Ivan Johansen
Graph is an open source application used to draw mathematical graphs in a coordinate system.
 DPlot 2.3.0.6
HydeSoft Computing
DPlot is a general purpose plotting program designed for scientists, engineers, and students.
 ecGraph 2.13
Encore Consulting Pty Ltd
ecGraph is a powerful graphing ActiveX control that you can drop into your Visual Basic programs to create graphs in a huge range of styles.